ASSESMENT OF SOME HAEMATOLOGICAL INDICES OF TUBERCULOSIS PATIENTS ACESSING CARE IN SOME HEALTH FACILITIES IN YENAGOA, BAYELSA STATE SOUTH-SOUTH NIGERIA.
Atiegha Christian, Daniel Samuel and Imeni, Awudumaro Abigail 1 ,
Department of Medical Laboratory Sciences, College of Health Technology Otuogidi-Ogbia, Bayelsa State
All Corresponding to: Atiegha Christian Email:direala40@gmail.com
Cell Phone: +2347082062542 ORCID NUMBER:
ABSTRACT
Tuberculosis (TB) is a major health concern and leading infectious killer disease caused in man by the bacterium TMycobacterium tuberculosis. Tuberculosis as a disease is known to affect the haematological balance of patients. This study therefore was carried out to evaluate the effect of tuberculosis and its therapy on some haematological parameters in tuberculosis subjects accessing care in some health faciliyies in Yenagoa, The place of study was the Tuberculosis and Leprosy Hospital Igbogene, the Federal Medical Center Yenagoa (FMCY) and Niger Delta University Teaching Hospital (NDUTH) all in Bayelsa state. ALongitudinal study design was adopted to recruit 50 newly diagnosed TB subjects and 50 apparently healthy control subjects (who are age and sex matched) and monitored at two months interval until the end of their treatment of six (6) months. Sputum samples were used for AFB, whole blood for the analysis of HB, PCV, RBC, Platelet and WBC. Ziehl-Neelson and the Gene Xpert were employed to analyze the sputum samples while Abacus 380 haematology autoanalyzer was used to assay the haematological indices. The test of significance was determined by analysis of variance (ANOVA) and post hoc. Values with p < 0.05 were considered significant. The result shows that PCV, Hb, and RBC were significantly lower in value (p<0.05), (38.65±4.20% vs 12 12 29.67±6.19%, 13.13±1.08g/dl vs 10.48±1.55g/dl and 5.05±0.63X 10 vs 3.92±0.51 x 10 /l) respectively, while WBC and 9 9 12 12 platelets increased significantly (6.21±1.89 x 10 /l vs 13.61±1.32 x 10 /l, 214.50±64.45 x 10 /l vs501.34±60.23 x 10 /l) respectively when controls were compared to the newly diagnosed subjects. The values of all parameters monitored at two months interval of treatment are seen to be returning towards control values. Significantly the study revealed that all parameters studied reverted back to almost control values at the end of the fourth month of treatment. There were no significant difference between values as at the end of the fourth month and at the end of the sixth month of treatment (39.19± 3.79% vs 39.32± 3.03% and p= 0.869 for PCV, 12.70±0.90g/dl vs 13.05±0.90g/dl, p= 0.332 for Hb., 5.03± 0.31 X 12 12 9 9 10 /l vs 5.12± 0.26 X 10 /l, P= 0.149 for RBC, 6.68±1.99 X 10 /l vs 6.48±2.93 X 10 /l, p= 0.720 for RBC and 12 12 225.58±74.60 X 10 /l vs 220.74±80.61 X 10 /l, p= 0.781 for platelet ). We conclude by saying researchers should carry out further test to look at the possibility of ending anti- tuberculosis therapy at four (months).
Keywords: Tuberculosis, Longitudinal, Platelet
INTRODUCTION
Tuberculosis (TB) is an infectious disease that most often affects the lungs and is caused by a type of bacteria. It spreads through the air when infected people cough, sneeze or spit.Tuberculosis, a deadly and contagious infection, has killed more people than any other infectious diseases in the previous two centuries, though it has been around for hundreds of years1,2,3.
When inhaled the bacillus enters the body via droplets or dust particles containing it. The infection is categorized as pulmonary tuberculosis or non- pulmonary tuberculosis. In pulmonary tuberculosis, the pulmonary aveoli and surrounding lymph glands are lodged by the bacilli resulting in lesion characterized by acute inflammatory reactions with accumulation of fluid and white blood cells around the aveoli, while the non-pulmonary tuberculosis includes the renal and urogenital tuberculosis, miliary tuberculosis and tuberculosis meningitis with varying symptoms4.
In 2019, TB remained the most common cause of death from a single infectious pathogen. Globally, an estimated 10.0 million people developed TB disease in 2019, and there were an estimated 1.2 million TB deaths among HIVnegative people and an additional 208, 000 deaths among people living with HIV. Adults accounted for 88% and children, aged <15 years, for 12% of all people with TB.
Most people who developed TB in 2019 were in the WHO regions of South-East Asia (44%), Africa (25%), and the Western Pacific (18%), with smaller percentages in the Eastern Mediterranean (8.2%), the Americas (2.9%) and Europe (2.5%). Eight countries accounted for two thirds of the global total: India (26%), Indonesia (8.5%), China (8.4%), the Philippines (6.0%), Pakistan (5.7%), Nigeria (4.4%), Bangladesh (3.6%) and South Africa (3.6%)5 . The disease burden in Nigeria is rated as the highest in Africa6 .
Tuberculosis not only affects lungs but also the bone marrow and causes significant hematological abnormalities such as anemia, leukocytosis neutrophilia, lymphopenia, thrombocytopenia and also elevated ESR in the patients8
Haematological parameters are those that are related to blood and blood forming organs; they are altered in values in most sicknesses and diseases and in chemotherapy The most common haematological parameters are the indicators 8 of haemoglobin concentration . Hematological parameters like hemoglobin, Packed Cell Volume (PCV), red blood cell (RBC) count, blood indices, platelet count, white blood cell (WBC) count, erythrocyte sedimentation rate (ESR) can be used for diagnosis, prognosis, and follow-up of patients 9 .
In order to prevent and control this disease, early diagnosis and treatment is a necesity , and monitoring TB patients during treatment is imperative for better outcomes10
This study was carried out to investigate the haematological profile of TB patients in the disease state as well as during and at the end of treatment which will help in the monitoring of treatment responses
MATERIALS AND METHODS
Study Design
This was a prospective study carried out in three facilities in Bayelsa state Nigeria namely the Federal Medical Center (FMCY), Niger Delta University Teaching Hospital (NDUTH) and the Tuberculosis and Leprosy Hospital for a duration of ten (10) months from February 2022 to November of the same year. Fifty newly diagnosed Tuberculosis and fifty apparently healthy controls subjects who were age and sex mathched participated in the study. Tuberculosis subjects were monitored at two months interval of treatment until the end of the treatment period (six months)
Ethical approval was sought for and obtained from the ministry of Health Bayelsa State, Research and Ethics committee in FMCY and from a similar committee at NDUTH before the commencement of the work. Written consent was sought from all the participating subjects and only those who gave theirs were enrolled.
Sputum was collected in a sterile wide mouthed container. Three samples made up of spot, early morning and spot were collected from each patient. Two and half mililitres (2.5mls) of the blood was also collected by venous puncture and dispensed into a prepared Ethylyne Diamine Tetracetic Acid (EDTA) container holding 0.05 ml of 10% of EDTA
Sputum analysis was by the Ziehl Neelson (AFB) technique as decribed by Ochei and kolhatkar11 , and the Genexpert technique by David Alan and Cepheid Inc. as modified by Catharina et. al12 .
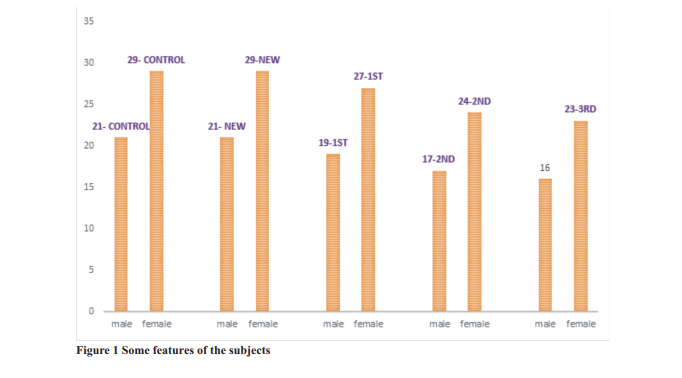
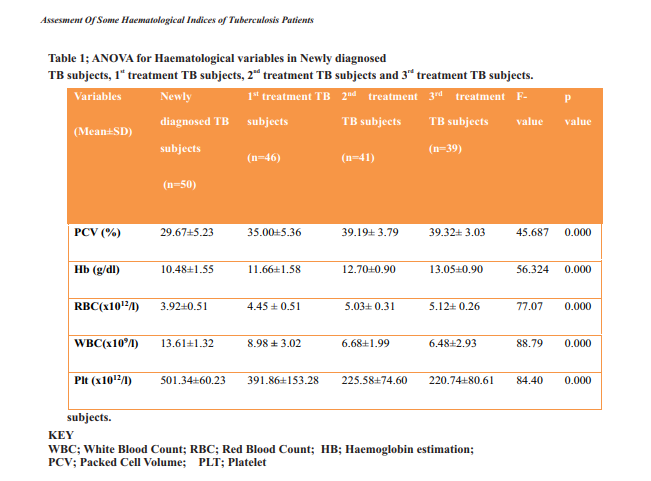
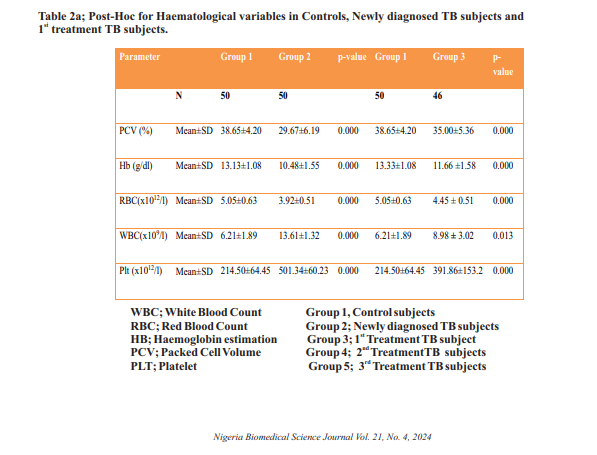
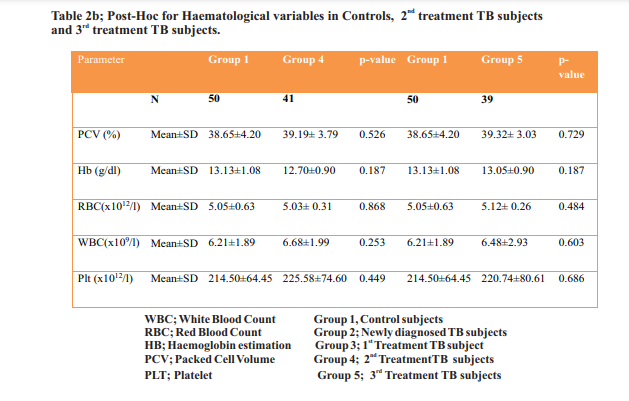
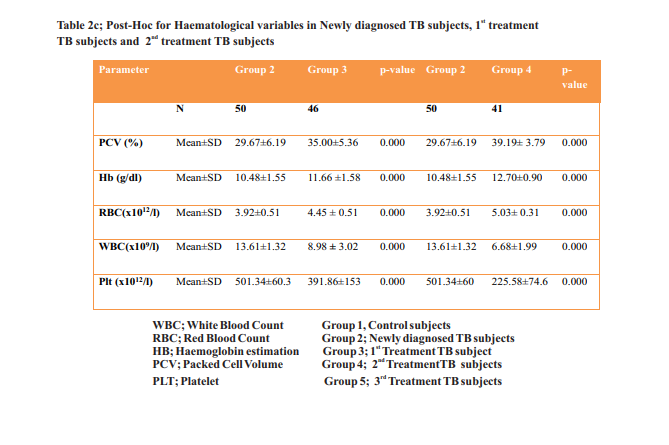
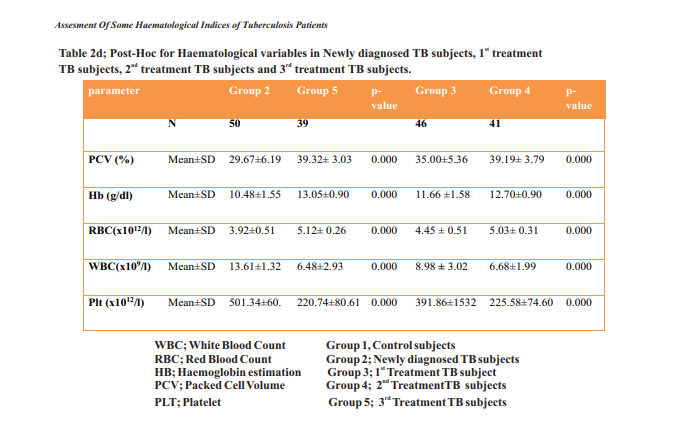
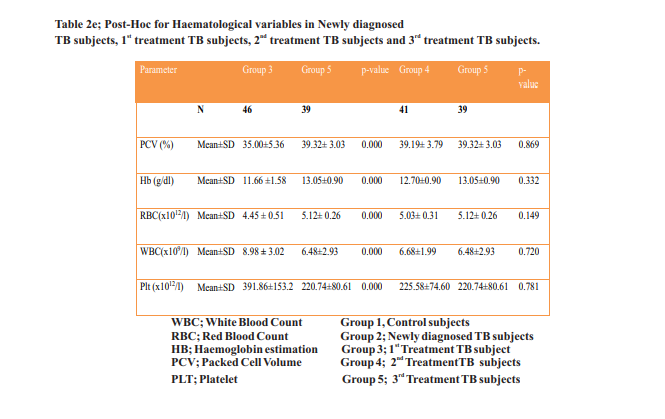
Table 1. is the ANOVAfor Haematological variables in Newly diagnosed
TB subjects, 1st treatment TB subjects, 2nd treatment TB subjects and 3rd treatment TB subjects.There were significant increases (p = 0.000) in the values of PCV, Hb and RBC when comparison were made from Newly diagnosed TB subjects to 3 treatment TB subjects. Similarly, there were significant decreases (p = 0.000) in the values of WBC and Plt when the mean values of Newly rd diagnosed TB subjects to 3 treatment TB subjects were compared
Table 2a is the Post-Hoc analysis for Haematological st variables in Controls, Newly diagnosed TB subjects and 1 treatment TB subjects. There were significantly lower Mean±SDvalues of PCV, Hb and RBC (p = 0.000, p = 0.000 and p = 0.000 respectively) in Newly diagnosed TB subjects when compared to controls. The control and Newly diagnosed values respectively are 38.65±4.20/29.67±6.19 % for PCV, 13.13±1.08/10.48±1.55g/dl for Hb and 5.05± 12 0.63/3.92±0.51X 10 /l for RBC. The Mean±SD valuesof WBC and Plt were significantly higher in Newly diagnosed TB subjects (p = 0.000 and p = 0.000 respectively) when compared to controls with values of 6.21±1.89/13.61±1.32 9 12 x 10 /l and 214.50±64.45/501.34±60.23x 10 /l.
There were significantly lower Mean±SDvalues of PCV, Hb and RBC (p = 0.000, p = 0.000 and p = 0.000 st respectively) in 1 treatment TB subjects when compared to st controls. The control and 1 treatment values respectively are 38.65±4.20/35.00±5.36% for PCV, 13.33±1.08/11. 66± 12 1.58g/dl for Hb and 5.05±0.63/4.45 ± 0.51 X 10 /l for RBC. The Mean±SD values of WBC and Plt were significantly st higher in 1 treatment TB subjects (p = 0.013 and p = 0.000 respectively) when compared to controls with values of 6.21±1.89/8.98 ± 3.02 x 10 /l and 214.50±64.45/391.86± 12 153.28 x 10⁹/l
Table 2b is the Post-Hoc for Haematological variables in Controls, 2nd treatment TB subjects and 3rd treatment TB subjects
There was no significant difference (p = 0.526) in the value of PCV, 38.65±4.20% in controls compared to 39.19± nd 3.79% in 2 treatment TB subjects. Similarly there was no significant difference (p = 0.187) in the value of Hb, 13.33±1.08g/dl in controls compared to 12.70±0.90g/dl in nd 2 treatment TB subjects. All the rest parameters in the table followed the same pattern. There were no significant difference in the value of RBC (p = 0.868), WBC (p = 0.253) 12 and Plt (p = 0.449) when control values 5.05±0.63 x 10 /l, 9 12 6.21±1.89 x 10 /l and 214.50±64.45 x 10 /l was compared nd 12 to 2 treatment TB values of 5.03± 0.31 x 10 /l, 6.68±1.99 x 9 12 10 /l and 225.58±74.60 x 10 /l respectively
There was no significant difference in the value of PCV, rd 38.65±4.20% in controls compared to 39.32± 3.03% in 3 treatment TB subjects (P = 0.729). The value of Hb, 13.33±1.08g/dl in controls was not significant when rd compared with 13.05±0.90g/dl in 3 treatment TB subjects. The table also reveals that there were no significant differences in the value of RBC (p = 0.484), WBC (p = 0.603) and Plt (p = 0.686) when control values 5.05±0.63 x 12 9 12 10 /l, 6.21±1.89 x 10 /l and 214.50±64.45 x 10 /l was rd 12 compared to 3 treatment TB values of 5.12± 0.26 x 10 /l, 9 12 6.48±2.93x 10 /l and 220.74 ±74.60 x 10 /l respectively
Table 2c is the Post-Hoc for Haematological variables st in Newly diagnosed TB subjects, 1 treatment TB subjects nd 2 treatment TB subjects.There were significantly increased (p = 0.000) values in the mean levels of PCV, Hb and RBC 35.00±5.36%, 11.66 ±1.58g/dl and 4.45 ± 0.51 x 12 st 10 /l in 1 treatment TB subjects compared to values of Newly diagnosed TB subject 29.67±5.23%, 10.48±1.55g/dl 12 and 3.92±0.51 x 10 /lrespectively. The mean values of WBC and Plt were significantly decreased (P= 0.000) when st 9 1 treatment TB subjects (8.98 ± 3.02 x 10 /l and 391.86± 153.28 x 10 /l) was compared to newly diagnosed TB 9 12 subjects (13.61±1.32x 10 /l and 501.34±60.23 x 10 /l).
There were significantly increased (p = 0.000) values in the mean levels of PCV, Hb and RBC 39.19± 3.79%, 12 nd 12.70±0.90g/dl and 5.03± 0.31x 10 /l in 2 treatment TB subjects compared to values of Newly diagnosed TB subject 29.67±5.23%, 10.48±1.55g/dl and 3.92±0.51 x 12 10 /lrespectively. The mean values of WBC and Plt were nd significantly decreased (P = 0.000) when 2 treatment TB 9 subjects (6.68±1.99 x 10 /l and 391.86± 225.58±74.60 x 12 10 /l) was compared to newly diagnosed TB subjects 9 12 (13.61±1.32x 10 /l and 501.34±60.23 x 10 /l).
There were significantly increased (p = 0.000) values in the mean levels of PCV, Hb and RBC 39.19± 3.79%, 12 nd 12.70±0.90g/dl and 5.03± 0.31x 10 /l in 2 treatment TB subjects compared to values of Newly diagnosed TB subject 29.67±5.23%, 10.48±1.55g/dl and 3.92±0.51 x 12 10 /lrespectively. The mean values of WBC and Plt were nd significantly decreased (P = 0.000) when 2 treatment TB 9 subjects (6.68±1.99 x 10 /l and 391.86± 225.58±74.60 x 12 10 /l) was compared to newly diagnosed TB subjects 9 12 (13.61±1.32x 10 /l and 501.34±60.23 x 10 /l).
Table 2d is the Post-Hoc for Haematological variables st in Newly diagnosed TB subjects, 1 treatment TB subjects, nd rd 2 treatment TB subjects and 3 treatment TB subjects. There were significantly increased mean levels of PCV (P= 0.000), Hb (p = 0.000) and RBC (p = 0.000) when mean values of Newly diagnosed TB subjects 29.67±5.23%, 12 10.48±1.55g/dl and 3.92±0.51x 10 /l were compared to rd that of 3 treatment TB subjects 39.32± 3.03%, 13.05± 0.90 12 g/dl and 5.12± 0.26 x 10 /l respectively. There were significantly reduced mean levels of WBC (p = 0.000) and Plt (p = 0.000) when mean values of Newly diagnosed TB 9 12 subjects 13.61±1.32 x 10 /l and 501.34±60.23 x 10 /l were rd compared to that of 3 treatment TB subjects 6.48±2.93x 9 12 10 /land 220.74±80.61 x 10 /l respectively
There were significantly increased mean levels of PCV (P= 0.000), Hb (p = 0.000) and RBC (p = 0.000) when mean st values of 1 treatment TB subjects 35.00±5.36%, 11.66 12 ±1.58g/dl and 4.45 ± 0.51x 10 /l were compared to that of nd 2 treatment TB subjects 39.19± 3.79%, 12.70±0.90g/dl 12 and 5.03±0.31 x 10 /l respectively. There were significantly reduced mean levels of WBC (p = 0.000) and Plt (p = 0.000) st when mean values of 1 treatment TB subjects 8.98 ± 3.02 x 9 12 10 /l and 391.86± 153.28 x 10 /l were compared to that of nd 9 2 treatment TB subjects 6.68±1.99 x 10 /land 12 225.58±74.60 x 10 /l respectively
Table 2e is the Post-Hoc for Haematological variables st nd rd in 1 treatment TB subjects, 2 treatment TB subjects and 3 treatment TB subjects. There were significantly increased mean levels of PCV (P = 0.000), Hb (p = 0.000) and RBC (p st = 0.000) when mean values of 1 treatment TB subjects 12 35.00±5.36%, 11.66 ±1.58g/dl and 4.45 ± 0.51 x 10 /l were rd compared to that of 3 treatment TB subjects 39.32± 12 3.03%, 13.05±0.90g/dl and 5.12± 0.26 x 10 /l respectively
There were significantly reduced mean levels of WBC st (p = 0.000) and Plt (p = 0.000) when mean values of 1 9 treatment TB subjects 8.98 ± 3.02x 10 /l and 391.86± 12 rd 153.28 x 10 /l were compared to that of 3 treatment TB 9 12 subjects 6.48±2.93x 10 /land 220.74±80.61 x 10 /l respectively
There was no significant difference (P = 0.869) in the nd value of PCV, 39.19± 3.79% in 2 treatment TB subjects rd compared to 39.32± 3.03% in 3 treatment TB subjects. The nd value of Hb, 12.70±0.90g/dl in 2 treatment TB subjects was not significant when compared with 13.05±0.90g/dl in rd 3 treatment TB subjects (p = 0.332). The table also reveals that there were no significant differences in the value of RBC (p = 0.149), WBC (p = 0.720) and Plt (p = 0.781) when nd 12 2 treatment TB subjects values 5.03± 0.31x 10 /l, 9 12 6.68±1.99 x 10 /l and 225.58±74.60x 10 /l were compared rd 12 to 3 treatment TB values of 5.12± 0.26 x 10 /l, 6.48±2.93x 9 12 10 /l and 220.74 ±74.60 x 10 /l respectively.
Discussion
In this study, the effects of tuberculosis were clearly demonstrated on the haematological parameters. One of the major findings in this study was that tuberculosis infection adversely affected haematological parameters either as an increase or decrease in value. There were lower values of
Hb, PCV and RBC. In the first analysis where the means of the control subjects and newly diagnosed TB subjects were compared, there was a statistically significance (P<0.05) decrease observed on these parameters. The reason for reduced haemoglobin level in tuberculosis disease has been attributed to poor nutritional status of the patients and poor absorption of micro-nutrients needed for blood production. Pulmonary tuberculosis being a chronic ailment, impacts negatively on the haemopoietic system leading to a decrease 14,15 in erythropoeisis. However, the Hb and PCV values among the newly diagnosed TB subjects where observed to be high as compared to other studies such as the work of 15 16 Akpan et. al., 2012 and Nwankwo et. al., 2005 in Calabar and Kano respectively. This could be attributed to the culture of high intake of haematinics by sick persons and perhaps the native diets in the area rich in iron such as periwinkles, fish and other sea foods
The haematological parameters that increased in value were the platelets and WBC. The mean±SD for platelet when compared with the control, shows a statistically significant increase with a p value of P=0.000 applying the students T-test analysis. This rise in platelet number might be related to increased levels of interleukin 6 and may lead 17 to a hypercoagulable state and deep vein thrombosis . The same theory was postulated by Lieberth et. al., 2015 . Our findings are in agreement with the findings of Andrew and Edwin, 2013 who reported that Mycobacterium17 tuberculosisinfection is associated with thrombocytosis
The WBC for the control and test group had a Pvalue of P = 0.000. In bacteriological infection, there is always the response from the body's immune system resulting to an elevated count of white cells above normal (leucocytosis).This was also the finding of Rohini et. al., 19 20 21 2016 , Wang et. al., 2021 and Barreda et al., 2020 who reported elevated counts of WBC in tuberculosis infection
The second part of this discussion focuses on the values of parameters under consideration in the follow-up cases during tuberculosis treatment. The tables above (Tables 2a – 2f ) considered the values of haematological parameters during the end of the first phase (two months) of anti TB st therapy here known as the 1 treatment group and the end of nd the fourth (4th) month period of treatment here known as 2 th treatment group as well as the end of the 6 month of rd tratment here known as the 3 treatment group
There were significantly lower values (P<0.05) of PCV, Hb and RBC when 1st treatment group were compared with controls. On the contrary, significantly higher values (p <0.05) were seen for WBC and Plt. When Newly diagnosed st group were compared with 1 treatment group, the values of PCV, Hb and RBC were significantly increased (p=0.000).
That of WBC and Plts were significantly (p<0.05) decreased. These haematological parameters under consideration were all altered significantly as at the Newly st nd diagnosed stage but at the end of the 1 and 2 treatment stage are seen to be returning towards control values. This suggests that all factors responsible for the alterations of these values were not permanently altered and were being reversed during the treatment. In a similar study Leonardo 22 et. al., (2019) opined that pulmonary tuberculosis (PTB) is associated with chronic inflammation and anaemia. They however could not acertain how anaemia impacts systemic infammation in PTB patients undergoing antituberculosis therapy (ATT). Their fndings revealed that most of anaemia cases were likely caused by chronic infammation. Adistinct biosignature related to anemia was detected which is defined by increased values of uric acid, C-reactive protein, and erythrocyte sedimentation rate. Importantly, anaemic patients sustained increased levels of several biochemical markers at day 60 of therapy. They concluded their work by saying TB patients with anaemia exhibit a distinct infammatory profle, which is only partially reverted at day 60 of ATT22
Furthermore, Manjunath, Sanju and Sagar (2011) , reported that Autoimmune haemolytic anemia (AIHA) represents a spectrum of disorders in which antibodies against self antigens on the erythrocyte membrane cause a shortened red blood cell (RBC) life span. AIHAcan occur as an idiopathic (primary) disorder or can coexist with another disease (secondary). AIHA can also occur following administration of certain drugs (drug induced). All these did not happen in anti TB therapy. Also they found out that Tuberculosis presents with a wide variety of haematological manifestations. Anemia in tuberculosis is most often due to nutritional deficiency, malabsorption syndromes, failure of iron utilization, and bone marrow suppression. AIHA is exceedingly rare in tuberculosis.The most common form of anaemias in TB is normocytic normochromic anemia
Eyuel et al (2016) in their research on TB subjects in Ethiopia observed similar findings on RBCs, WBCs, Hb, PCV and Plt, and so does Sharma, Mohan & Sharma, 26 (2012) , who worked on the challenges on diagnosis and treatment of TB. Other similar works with the same findings are (Lugito et. al., 2019 , Sanchez-Codez et. al., 2020 , 29 Alende-Castro et. al., 2020 , Elziny, 2021 and Zunt, 30 2018 )
Further more, it coulkd be observed from table 2e that nd the comparism of the mean values between 2 treatment rd group and 3 treatment groups of all parameters studied were not significant (p>0.05). The inference here is that at the end of the fourth month of treatment haematological parameters were fully restored as there were also no significant difference (p>0.05) when there values were compared to controls.
CONCLUSION
From the study above we want to suggest that researhers should look into the issue of six month treatment of anti- tuberculosis therapy since studed parameters were found to return to normal at the end of the fourth month of treatment.
REFERENCES
- WHO, (2023). Tuberculosis-Key facts. Retrieved from https://www.who.int/news-room/fact-sheets/ detail/tuberculosis on 12/09/2023 at 5.12 AM
- Paulson, T. (2013). Epidemiology: A mortal foe. Nature, 502(7470):S2–S3.
- WHO. World health organization facts sheet 2020. https://www.who.int/en/news-room/fact-sheets / detail/tuberculosis.
- Hanifa, Y., Toro Silva, S., Karstaedt, A., Sahid, F., Charalambous, S., Chihota, V. N., ... & Grant, A. D. (2019). What causes symptoms suggestive of tuberculosis in HIV-positive people with negative initial investigations?. The International Journal of Tuberculosis and Lung Disease, 23(2), 157-165
- Chakaya, J., Khan, M., Ntoumi, F., Aklillu, E., Fatima, R., Mwaba, P., ... & Zumla, A. (2021). Global Tuberculosis Report 2020–Reflections on the Global TB burden, treatment and prevention efforts. International journal of infectious diseases, 113, S7- S12
- Federal Ministry of Health. (2019). Department of Public Health. Draft 2019 Annual TB Report. National Tuberculosis and Leprosy Control Programme
- and Munogolo, Z.K., 2023. Pancytopenia and Pulmonary Tuberculosis: A Case Report. Journal of Tuberculosis Research, 11(2), pp.62-66.
- Obeagu, E. I., Obeagu, G. U., & Adepoju, O. J. (2022). Evaluation of haematological parameters of pregnant women based on age groups in Olorunsogo road area of Ido, Ondo state. J. Bio. Innov11 (3), 936-941.
- Peresi, E., Silva, S. M. U. R., Calvi, S. A., MarcondesMachado, J. (2008). Cytokines and acute phase serum proteins as markers of inflammatory regression during the treatment of pulmonary tuberculosis. Jornal Brasileiro de Pneumologia, 34, 942-949.
- Abay, F., Yalew, A., Shibabaw, A. and Enawgaw, B. (2018). Hematological abnormalities of pulmonary tuberculosis patients with and without HIV at the University of Gondar Hospital, Northwest Ethiopia: a comparative cross-sectional study. Tuberculosis research and treatment, 2018. Trends Clin. Med. Sci. 2023, SI: Indian Medical Research Views & Findings on Last 5 years, 70-74.
- Ochei, J. & Kolhatkar A, (2006) Medical Laboratory Science, Theory and Practice. Tata McGraw- Hill Publishing company limited New Delhi.Pp:727- 729.
- Catharina C. B., Pamela N., Doris H Mark P. N. Shubhada S., Fiorella K., Jenny A, B.T., Rasim T., Robert B., Roxana R., Ana M. and Martin J.. (2010). Rapid Molecular Detection of Tuberculosis and Rifampin Resistance. The New England Journal of Medicine ; 363:1005-1015.
- Chhabra, G (2018). "Automated hematology analyzers: Recent trends and applications". Journal of Laboratory Physicians. 10 (1): 15–16.
- Akpan P.A, Akpotuzor J.O, Akwiwu E.C. (2012).Some Haematological Parameters of Tuberculosis (TB) Infected Africans: The Nigerian Perspective. Journal of Natatural Science Research; 2(1)
- Atiegha C, Ibeh N.C. & Stella U.K. (2019); Effect Of Directly Observed Treatment Shortcourse (Dots) On Some Hematological Parameters Of Male Patients With Pulmonary Tuberculosis Managed In A Health Facility In Bayelsa State, Nigeria. Researchjournali's Journal of Public Health. 5 (8).
- Nwankwo E.O.K, Kwaru A., Ofulu A& Babashani M. (2005) Haematological Changes in Tuberculosis in Kano, Nigeria. Journal of Medical Laboratory Science;14(2):35-39.
- Andrew A.R, Edwin W.G. (2013); Thrombocytosis is Associated with Mycobacterium Tuberculosis Infection and Positive Acid-Fast Stains in Granulomas. American Journal of Clinical Pathology; 139, 584- 586
- Lieberth k., Dana C. B., Paul B. & Jaming S. V. (2015). Pulmunary tuberculosis induces a hypercoagulable state. Journal of infection. 70: 324 – 334.
- Rohini, K., Surekha Bhat, M., Srikumar, P. S., & Mahesh Kumar, A. (2016). Assessment of hematological parameters in pulmonary tuberculosis patients. Indian Journal of Clinical Biochemistry, 31, 332-335.
- Wang, J. L., Yin, Q. Y., Han, C., Liu, F. L., & Wang, M. S. (2021). Risk factors for death in tuberculosis patients requiring ICU care. Epidemiology & Infection, 149, e22.
- Barreda, N. N., Arriaga, M. B., Aliaga, J. G., Lopez, K., Sanabria, O. M., Carmo, T. A., ... & Calderon, R. I. (2020). Severe pulmonary radiological manifestations are associated with a distinct biochemical profile in blood of tuberculosis patients with dysglycemia. BMC Infectious Diseases, 20(1), 1-14
- Leonardo G., Luís A. B. C., María B.A. (2019). Tuberculosis-associated anemia is linked to a distinct infammatory profle that persists after initiation of antitubercular therapy. Scientific Reports; 9:138.
- Manjunath N. Sanju C. K., Sagar T.G (2011). Immune Hemolytic Anemia in a Patient with Tuberculous Lymphadenitis. Journal of Global Infectious Diseases. 3 (1).
- Edson B, Carolina A. S., Flavia M. S. , Alexandre G. V., Daniela P. M. , Raquel V. C. , & Valeria C. R. (2021). Anemia in tuberculosis cases: Abiomarker of severity? PLOS ONE16 (2)
- Eyuel K., Bamlaku E., Eschalev G. and Baye G. (2016). Effects of anti-tuberculosis drugs on haematological profiles of patients tuberculosis attending at university of Gondar Hospital, North-West Ethiopia. Bionedcentral Hematology16:1.
- Sharma, S. K., Mohan, A., and Sharma, A. (2012). Challenges in the diagnosis & treatment of miliary tuberculosis. The Indian journal of medical research, 135(5), 703.
- Lugito, N. P. H., Lorens, J. O., Kwenandar, J., and Kurniawan, A. (2019). The dilemma in a case of immune thrombocytopenia in a patient with human immunodeficiency virus on antituberculosis treatment for miliary pulmonary tuberculosis. Oxford Medical Case Reports, 2019(11), 486-489.
- Sanchez-Codez, M., Hunt, W. G., Watson, J., & Mejias, A. (2020). Hepatitis in children with tuberculosis: a case report and review of the literature. BMC pulmonary medicine, 20(1), 1-4.
- Alende-Castro, V., Macía-Rodríguez, C., PáezGuillán, E., and García-Villafranca, A. (2020). Miliary pattern, a classic pulmonary finding of tuberculosis disease. Journal of Clinical Tuberculosis and Other Mycobacterial Diseases, 20, 100179.
- Elziny, M. M., Ghazy, A., Elfert, K. A., & Aboukamar, M. (2021). Case report: development of miliary pulmonary tuberculosis in a patient with peritoneal tuberculosis after COVID-19 upper respiratory tract infection. The American Journal of Tropical Medicine and Hygiene, 104(5), 1792.


Comments are closed.